
How My Demographic Estimates Became Central to the NY-11 Redistricting Case

Over the past year, I’ve built and released the first public national, precinct-level estimates of presidential vote choice by race. I worked with VoteHub to make these estimates free and publicly available through our national precinct map where users can explore the data across nearly any geography.
I didn’t expect those estimates to become a point of contention in a high-profile redistricting case, but they have. In the NY-11 litigation, my demographic estimates were introduced by Dr. Stephen Voss as a validation check about what the district’s political coalitions actually look like. The Petitioners’ Summation Memorandum attempts to discredit my estimates and peddles an alternative analysis by Boston University Professor Maxwell Palmer, but unfortunately does not engage substantively with my ecological inference framework or my claim that the independence assumption is strongly violated in many contexts. It does, however, take a brief detour to note my age, complete with a citation to my LinkedIn profile.
This post is my attempt to explain the key empirical dispute as clearly as possible: what NY-11 looks like politically, why traditional ecological inference methods struggle in places like Staten Island, and why I’m confident my estimates better reflect reality than traditional ecological inference models, including the one Professor Palmer employs.
(This is not meant to be a full methods piece. If you’re interested in a more technical explanation of how I produced my estimates and why I built the model the way I did, I’ve outlined the methodology publicly here: [link].)
NY-11 Background
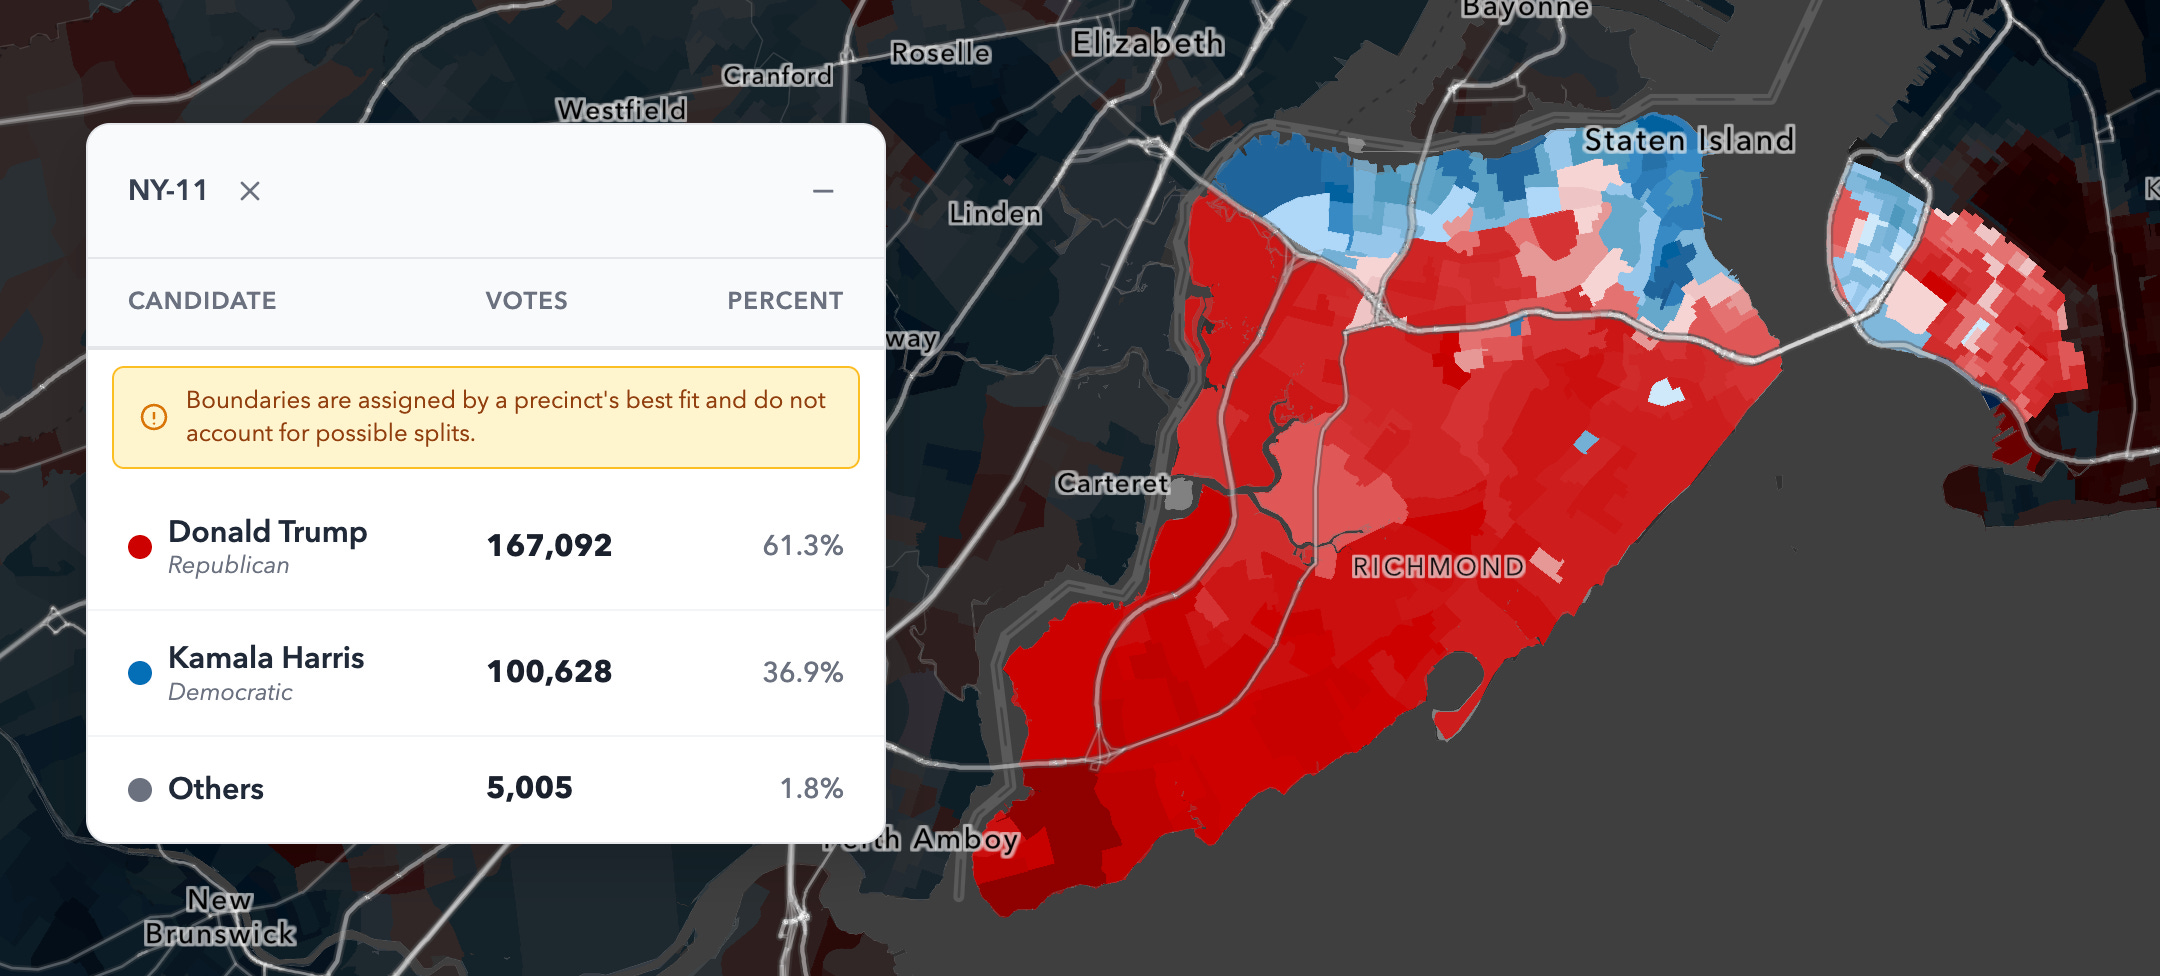
NY-11 is a heavily Republican district centered on Staten Island. In 2024, it was Trump +25, and the district is about 54% White. Politically, the geography is also straightforward: Southern Staten Island is extremely Republican, northern Staten Island is more diverse and votes more Democratic, and the portion of Brooklyn included in the district (Bay Ridge, Dyker Heights, and Bensonhurst) is mixed.
Plaintiffs argue that NY-11 should be treated as a VRA-protected coalition district, and that the current lines disenfranchise minority voters by preventing them from forming an effective coalition. The requested remedy is a redraw that would likely flip control of the district from red to blue.
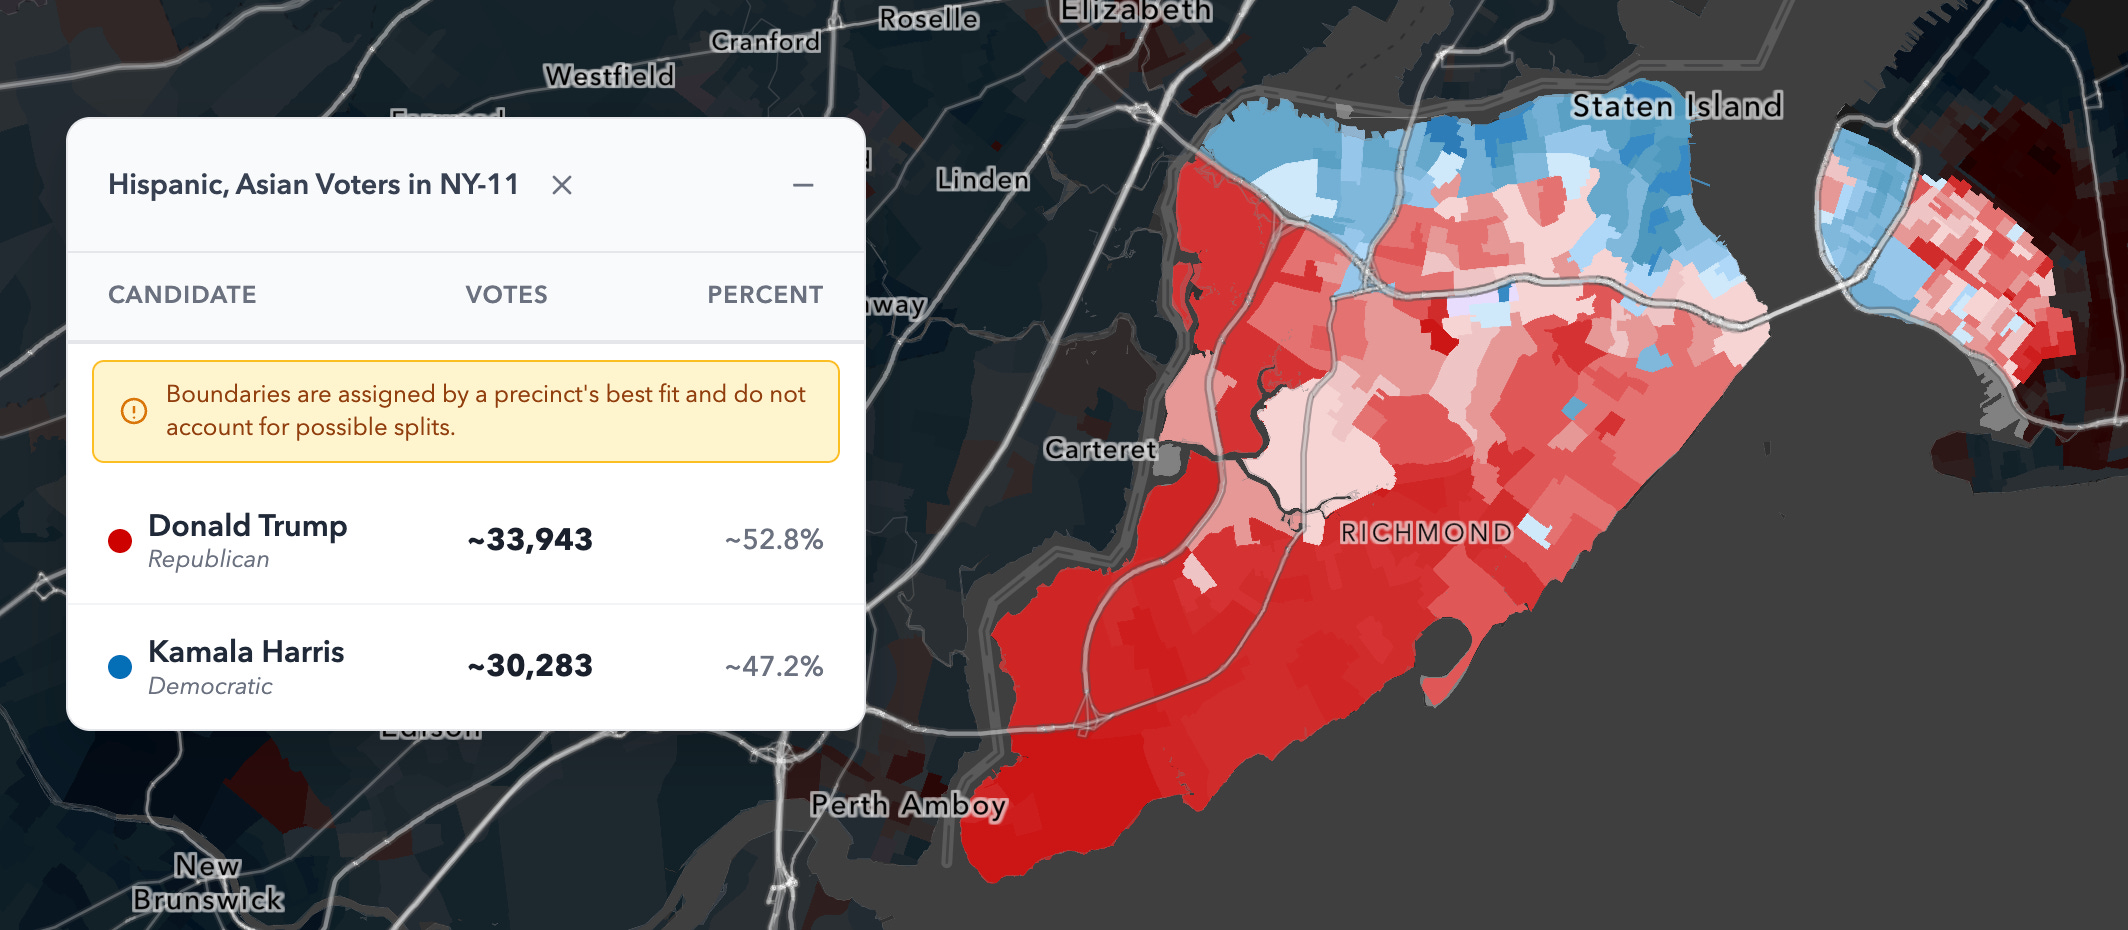
In the Petitioners’ Summation Memorandum, plaintiffs attempt to defend a specific empirical claim based on Prof. Palmer’s Report: that Hispanic and Asian voters in NY-11 form a strongly Democratic bloc that can anchor a coalition district. I do not believe this claim is supported by the data.
The Core Issue: Hispanic and Asian Voters in NY-11 Are Not a Blue Bloc
In my estimates, Hispanic and Asian voters in NY-11 are close to evenly divided, roughly splitting 50–50 between Trump and Harris in 2024.
That should not be surprising given broader national trends. Hispanic and Asian voters have shifted noticeably toward Republicans over the past eight years, and in 2024 they were not overwhelmingly Democratic groups nationally. NY-11 is also a Trump +25 district, so it would be unusual for the district’s non-Black minority groups to vote like they do in a place like San Francisco.
My topline estimates for NY-11 are:
White, Hispanic, and Asian voters were collectively around Trump +34
Those groups made up roughly 91% of the electorate
Where the Dispute Comes From
The opposing analysis comes from a report using traditional ecological inference methods by Prof. Maxwell Palmer. I respect a lot of Prof. Palmer’s work, but I strongly disagree with his conclusions in this case.
His report implies that 88.1% of Hispanic voters in NY-11 supported Kamala Harris in 2024. That number is hard to reconcile with both national benchmarks and basic facts of American political geography.
To put the number in context:
VoteHub’s national estimate for Hispanic Democratic support in 2024: 55%
Catalist’s national estimate for Hispanic Democratic support in 2024: 54%
Prof. Palmer finds that Hispanic voters in a very conservative House district were 30+ percent more Democratic than Hispanics nationally.
That gap should immediately raise skepticism, because it conflicts with a simple and well-established fact about U.S. elections: Hispanic partisanship, when measured at the precinct level, is strongly related to the surrounding local political environment. In other words, Hispanic voters in very Republican areas tend to be less Democratic than Hispanic voters in very Democratic areas, and vice versa.
So the claim is not merely that NY-11 Hispanics were a bit more Democratic than average. The claim is that they were dramatically more Democratic than national benchmarks in a district whose overall electorate is deeply Republican. It would place NY-11’s Hispanic vote among the most Democratic Hispanic electorates anywhere in the country, despite NY-11’s broader voting behavior pointing strongly in the opposite direction.
The Missing Piece: Aggregation Bias
The most important statistical issue here with Prof. Palmer’s analysis is the presence of aggregation bias, which occurs in ecological Inference when relationships inferred from aggregated data do not hold across different local contexts.
Traditional ecological inference often relies on assumptions that are violated when a demographic group’s political behavior varies sharply depending on the type of precinct they live in (known in the literature as the Independence Assumption, as described here in Section 2). Staten Island is a textbook example of that problem.
In NY-11:
Hispanic voters in Northern Staten Island are often located in more diverse precincts that also have substantial Black populations and vote strongly Democratic overall
Hispanic voters in Southern Staten Island are located in precincts that are overwhelmingly White and overwhelmingly Republican
We see this phenomenon across the country in voter registration data, such as here. Those two populations are very different. We should not expect that Hispanic voters living in very red suburban areas to vote the same way as those living in very diverse and blue urban cores.
If an ecological inference method extrapolates too heavily from the most Hispanic precincts in the district, it can produce exactly the kind of distortion seen here: a Democratic estimate for Hispanics that fits northern Staten Island fairly well, but becomes implausible when extended across the full borough.
What About Confidence Intervals?
A common response I’ve gotten in the past is that ecological inference models can generate confidence intervals and uncertainty bounds. In fact, Prof. Palmer’s lower bound in his CIs for Hispanic support of Kamala Harris in NY-11 is 81.1%.
That is a good feature in principle, but confidence intervals are only meaningful when the model is correctly specified. Unfortunately, even the low end of the CI bounds from Prof. Palmer’s analysis are implausible. When a method depends on an assumption that is violated, the confidence intervals do not represent valid uncertainty—they represent uncertainty around a distorted estimate. In other words, confidence intervals cannot compensate for systematic bias introduced by model misspecification.
The issue in NY-11 is not that we are missing precision. It is that the core assumptions used to infer group behavior in traditional ecological inference are not well-suited for the political geography of the district.
A Less Technical Summary
The simplest way to describe the independence problem in NY-11 is this:
Hispanic voters in very White, very Republican precincts vote differently than Hispanic voters in more Hispanic, more Black, heavily Democratic precincts.
Any approach that assumes those voters can be pooled into a single district-wide relationship will struggle. And that struggle will systematically pull estimates toward the behavior of the precincts that provide the clearest signal, which tend to be the most Hispanic precincts (which are blue in NY-11).
Ways to Evaluate the Competing Analyses
One reason this disagreement is difficult to resolve publicly is that I am currently the only analyst releasing national precinct-level demographic estimates. In practice, this is because extending traditional ecological inference methods to congressional districts and then scaling them nationally, as in Prof. Palmer’s approach, can produce results that are difficult to defend when examined across diverse political and geographic contexts.
Having previously applied traditional ecological inference methods to both election results and partisan registration data in regions like NY-11 and across the country, and having validated those results against voter file data, I have repeatedly encountered the same problems present here. That experience ultimately motivated me to develop a different approach, one specifically designed to remain reliable when the independence assumption is violated.
If precinct-level Hispanic vote estimates from Professor Palmer’s analysis were made available for NY-11, particularly across southern Staten Island, it would be even easier to evaluate the results transparently.
On VoteHub’s Model and Transparency
VoteHub’s model itself is not admissible in court because it is proprietary. Full disclosure would require the release of implementation details that the company is not prepared to make public, as the model is considered commercially valuable.
More generally, it is notable that traditional ecological inference methods such as those employed by Prof. Palmer continue to be characterized in legal filings as “state of the art.” While these approaches have a long and established history in the literature and form the basis for my model, we believe VoteHub’s model represents a meaningful methodological advancement and produces more accurate estimates in many contexts. It is precisely this improvement in performance and reliability that underlies the model’s commercial value.
That said, I want to be clear about what this does and does not mean. “Proprietary” does not mean that the model is unexplainable or opaque. VoteHub and I have been quite transparent for a private-sector model: the methodological structure is laid out publicly, minus a small number of constants and implementation details that are sensitive from a commercial standpoint.
That math is available here, down to a few constants introduced on Page 10: [link].
What I Am and Am Not Claiming
It’s important to separate two questions:
Whether the Voting Rights Act should apply here, and what the remedy is
What the voting behavior in NY-11 actually is
I am not a voting rights lawyer, and I do not have an opinion on how the legal question should be resolved. My focus is on the empirical claim of voting behavior underlying the case presented by the petitioners.
And empirically, the conclusion is clear:
Hispanic voters in NY-11 do not vote as a Democratic bloc. Traditional ecological inference analyses that suggest otherwise conflict with national benchmarks, with the district’s political reality, and with what we know about how demographic partisanship changes across political geography from voter file data.
Closing Thoughts
This case illustrates why ecological inference—and, in particular, careful treatment of violated independence assumptions and aggregation bias—has real-world consequences. More broadly, my work on ecological inference models and national estimates is driven by both intellectual interest and a commitment to producing analyses that are informative, transparent, and accessible to a wider audience, even as they invite public scrutiny.
Thanks for reading Data and Divergence. Subscribe for free to receive new posts and support my work.
Love this perspective. I'm so curious how you manage to stay focused on the empirical truth when faced with such irrelevent personal attacks, your resilience is inspiring.