
It’s Time to Do Away With Majority-Minority Districts
Here is how the VRA and Minority Voter Interest Groups hurt the voters they aim to protect and how we can fix this problem

Many readers are probably familiar with the idea of a majority-minority congressional district. Majority-minority districts are, as the name implies, US legislative districts where over 50% of the voting-age population (VAP) are minorities. Federal law introduces the idea of majority-minority districts to ensure that the voting power of minorities is not diluted, as per the Voting Rights Act (VRA) of 1965. Majority-minority districts comprise 32% of America’s 435 congressional districts, including 20 majority-Black districts. Unfortunately, majority-minority districts are not optimal in practice; majority-minority districts often hurt the voters they are designed to protect.
The Sweet Spot: How Can Black Voters Most Efficiently Be Allocated to Maximize their Electoral Impact?
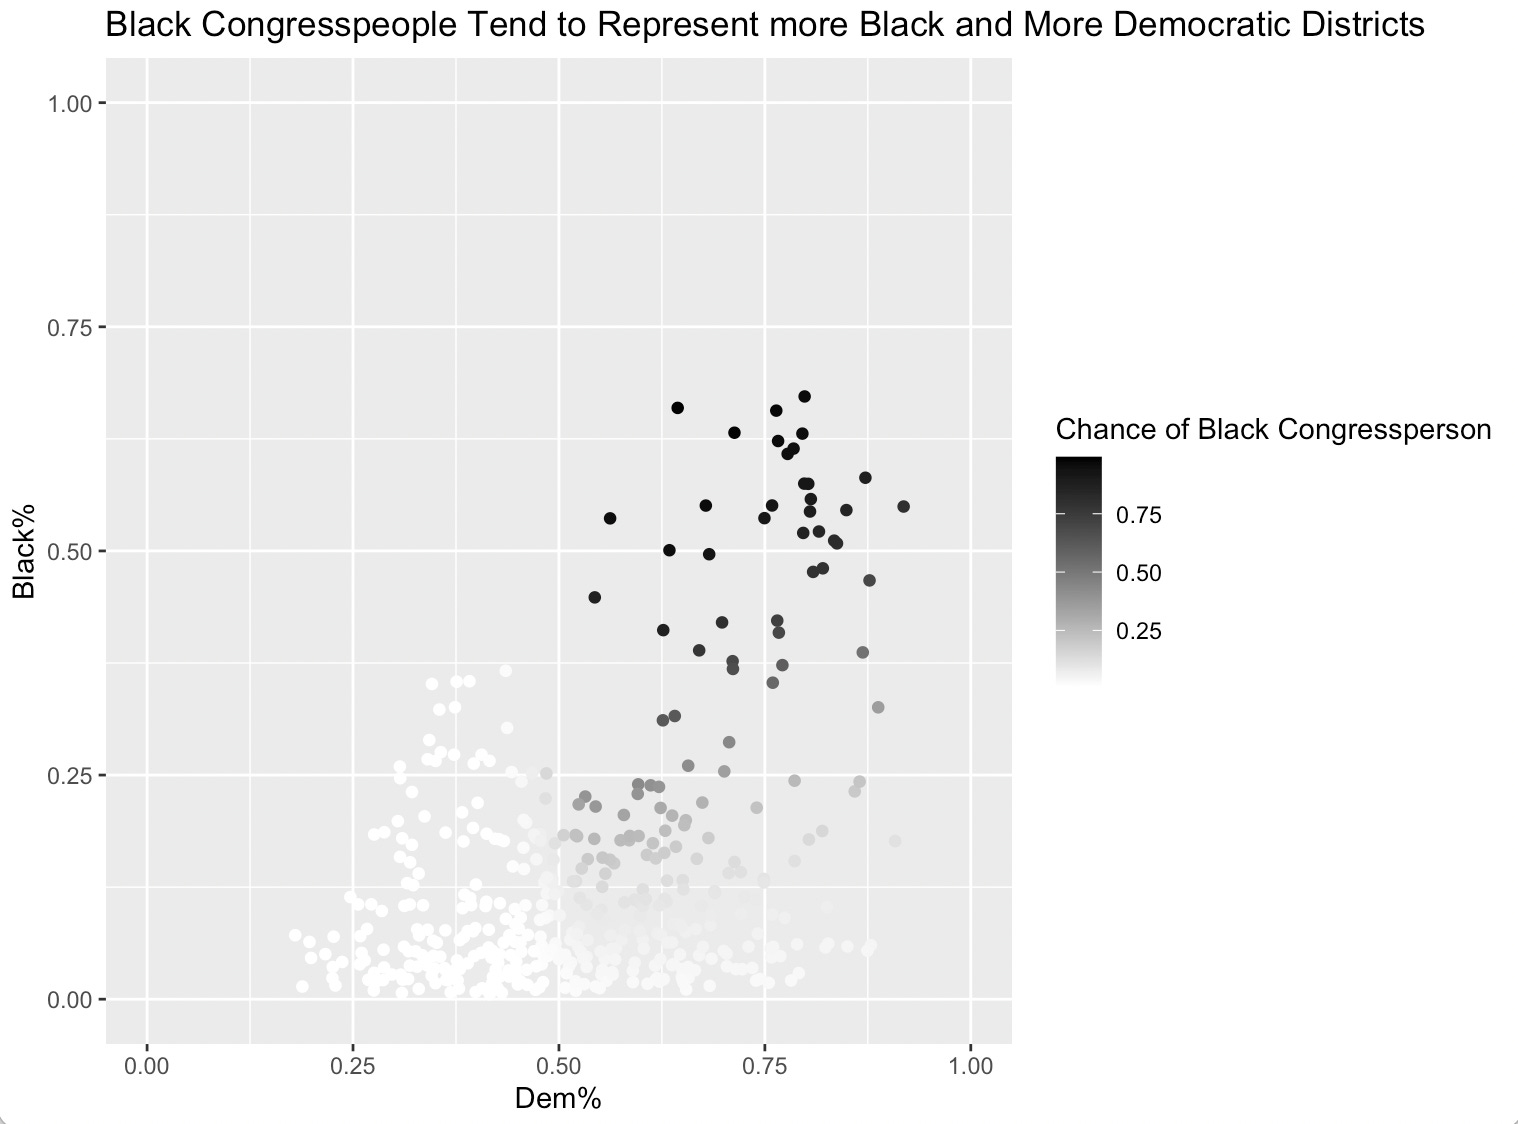
Majority-minority districts are drawn to comply with Section 2 of the VRA, which states that congressional districts should not be drawn in a way that “improperly dilutes minorities' voting power.” Many of you reading this are probably familiar with the concept of cracking, a technique where a specific community is divided into multiple districts to dilute its political representation. Establishing majority-minority districts prevents cracking since it ensures that a community of minority voters will have control over who is elected to represent their district. However, creating these districts engenders a new issue, which is packing. Packing is a term used to describe the consolidation of a constituency of voters into a single district. Generally, the Democratic party opposes the packing of minority voters since it minimizes the influence of these voters in surrounding districts. But by pushing for majority-minority districts, Democrats are packing their own voters. Majority-minority districts are overkill, and minority interest groups pushing for them are disenfranchising the voters they mean to protect. We modeled the likelihood that a district is represented by a Black congressperson depending on two factors, the percentage of voters in a district who are Black and the percentage who vote Democratic. As you can see below, 40%+ Black districts almost surely elect a Black congressperson.
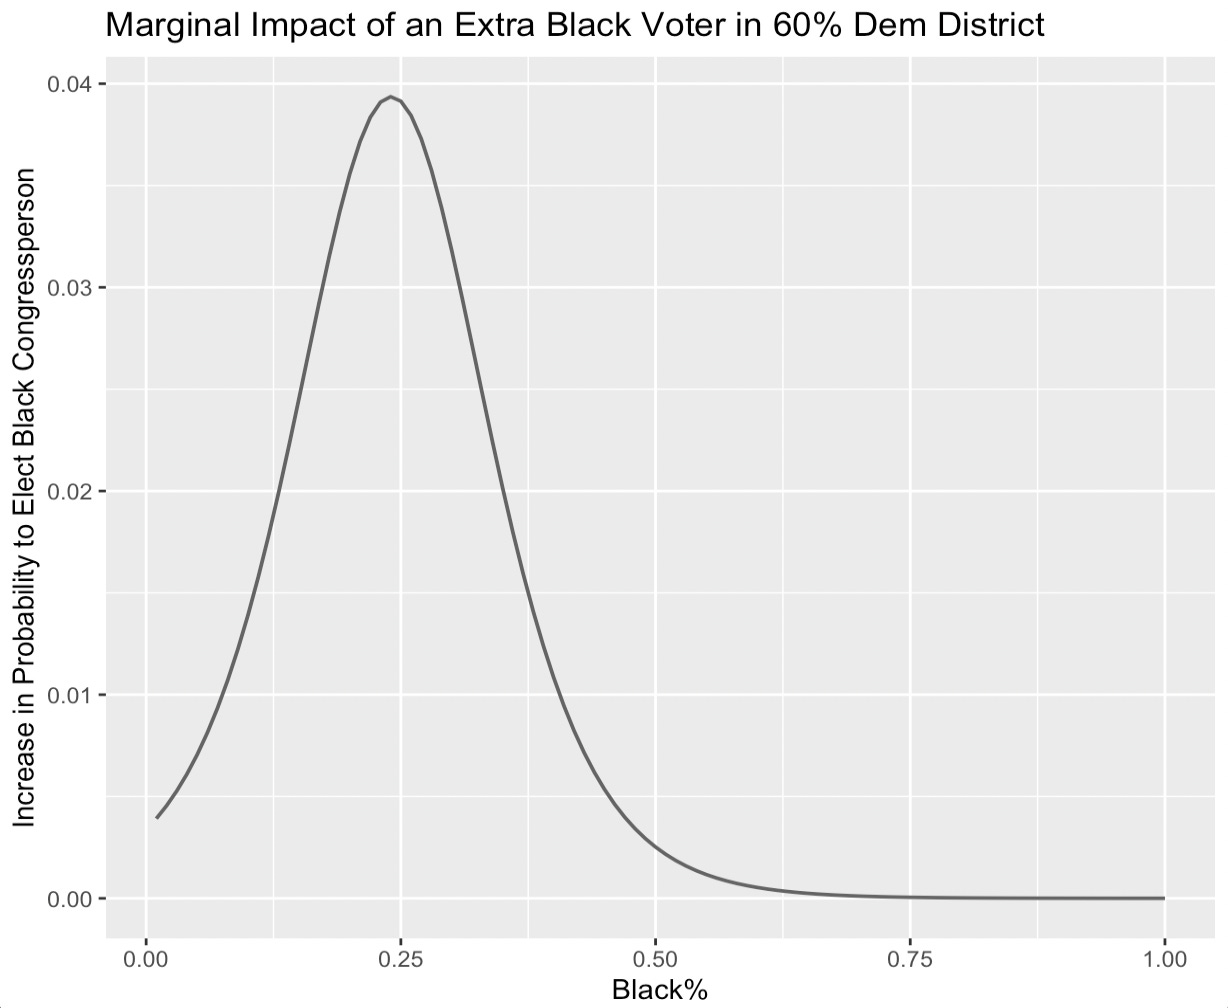
To find the “Sweet Spot,” or the optimal percentage of Black voters in a district to allow for maximal Black representation, we have to consider each Black voter's average marginal impact (AMI) on the probability of electing a Black congressperson in a district (given exogenous district partisanship). Up to a point, each extra Black voter added to a district has a larger and larger impact on the probability of Black representation. This suggests that to maximize Black representation, we should establish some districts with no Black voters and some “Black opportunity districts.” In these districts, the percentage of Black voters is optimized at the point that maximizes the AMI function (the argmax of the function). Below is an example of the “Sweet Spot” in a 60% Democratic district. For a more in-depth mathematical explanation, please see the Author’s Note at the end of this piece.
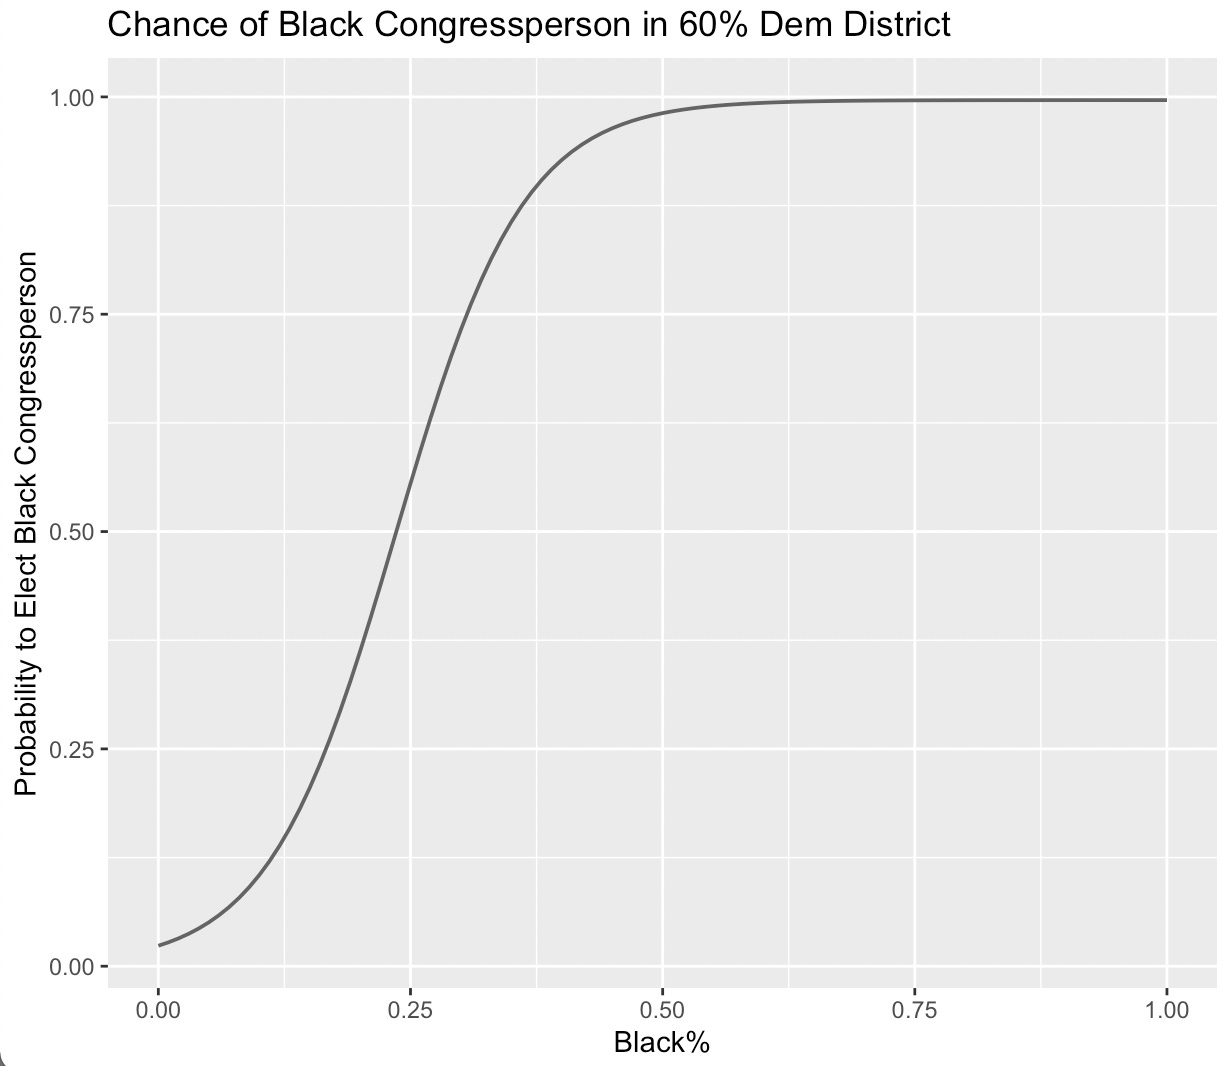
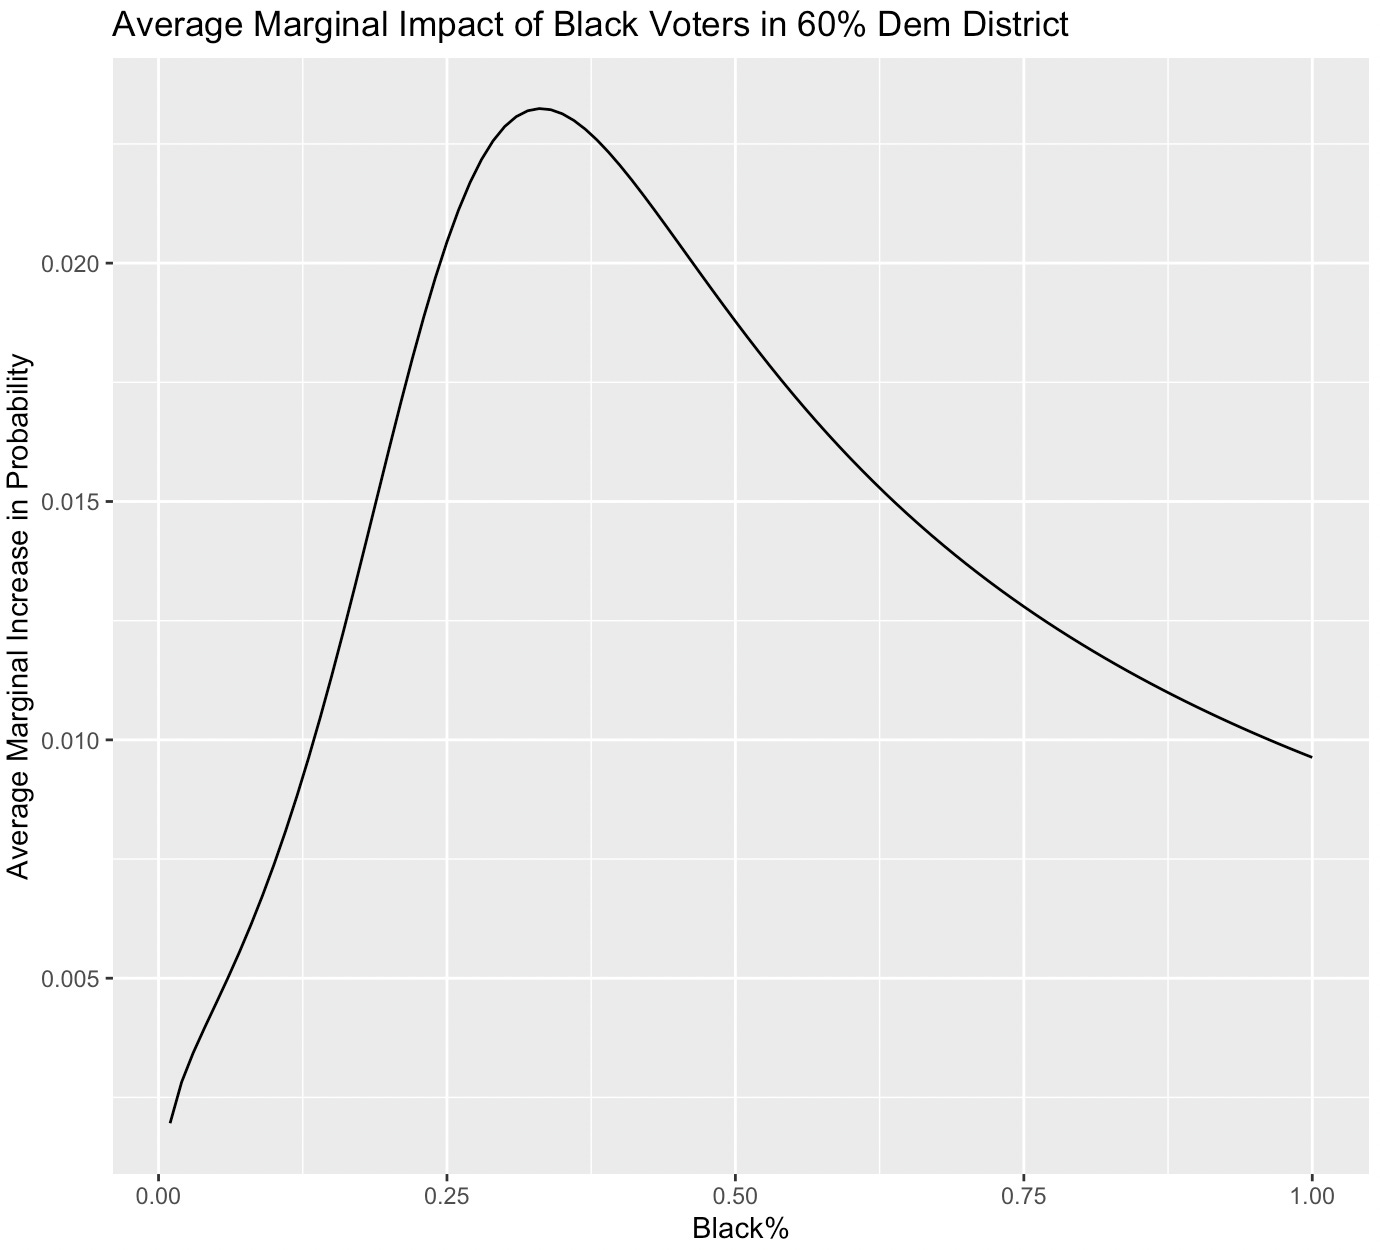
When 60% of a district's electorate are Democrats, the greatest electoral influence of Black voters is achieved when they comprise 33% of the voter base. This demographic proportion is the optimal distribution of Black voters, signifying the precise 'Sweet Spot' to maximize their electoral impact. Since the vast majority of Black voters and Black congresspeople are Democrats, the “Sweet Spot” depends on the proportion of Democratic voters in the district; if there are more Democratic voters, a higher proportion of Black voters is necessary to exert maximal influence in the Democratic primary. Below is a table of different “Sweet Spot” proportions depending on the district's partisanship.
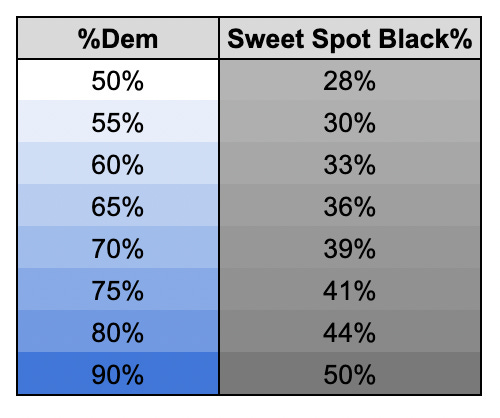
Assuming a district is less than 90% Democratic, majority-Black districts suboptimally allocate Black voters.
Illinois Democrats Eliminated Majority-Black Districts in 2021, Improving the Representation of Black Voters
Throughout the 2010s, Republicans held a substantial structural advantage in the US House (meaning the GOP could win control of the chamber despite winning fewer votes nationwide). I’ve written recently about why this structural advantage has begun to dwindle, and a big reason is that Democrats passed extremely effective gerrymanders in Illinois, Oregon, and New Mexico. In Illinois, during the 2022 Midterm Elections, Democrats managed to win ~82% of the districts in the state despite only winning ~55% of the two-party vote. Democrats created this clinical gerrymander by strategically allocating Black voters in the Chicago area, splitting them into various districts instead of concentrating them in just two to three. Against the wishes of the Legislative Black Caucus, Illinois decreased the Black VAP in IL-01 and IL-02 by an average of 5%, stripping one of the districts of its majority-black status. But since these Black Democrats were replaced with Republicans instead of white Democrats (and the districts were still Safely Democratic in the general elections), the probability these districts elected a Black representative was unchanged.
Let's dive deeper into the State Legislative redistricting process in Illinois in 2021, particularly highlighting the backlash faced by the state's Democrats from minority voter interest groups. A group called “Illinois African Americans for Equitable Redistricting” submitted a scathing 65-page complaint to the US Department of Justice criticizing Illinois Democrats for their 2021 State House and State Senate maps. The complaint says, “[Illinois] Democrats have effectively set Black voters back 40 years,” and primarily bases their argument on the fact that the map substantially decreases the number of majority-minority districts. The group argued that “[Illinois Democrats] made a concerted effort to draw as few majority Black districts as possible” and that the map conflicted with the 1965 VRA.
But, here is the catch: these new maps actually were better for Black representation than the previous ones. The complaint could not have been more wrong. While the previous maps were only projected to send 11.3 and 22.9 Black legislators to the State Senate and the State House, respectively, the 2021 redraws increased these figures to 11.7 and 23.7. Slashing the number of Black-majority districts more efficiently allocated Black voters (instead of packing them into fewer districts), allowing them to enjoy increased representation.
Future Democratic Gerrymanders Will Eliminate Majority-Minority Districts, but They Won’t Hurt Minority Representation
If Democrats can get the green light to gerrymander in other notable states with large minority populations (such as New York, Georgia, Pennsylvania, and California), minority voter interest groups will be the primary actors standing in the way of successful Democratic gerrymanders. Efficiently allocating minority voters means that majority-minority districts are not feasible. Luckily, as outlined above, majority-minority districts are terrible for minority representation anyways.
Right now, completely unregulated by national entities, gerrymandering is a full out arms-race for Democrats and Republicans within the states they control. Minority interest groups, try as they might, should not expect an extra VRA-mandated opportunity seat in AL, AR, LA, MS, or TN anytime soon. Democrats will have to effectively gerrymander while implementing maps leading to proper minority representation.
For those into the details of redistricting, let’s run through some examples below of effective gerrymanders that decrease the number of Black majority districts but are still great for minority representation.
Georgia
As Georgia trends toward the Democratic Party, Republicans will try to prevent Democrats from taking full control of the state’s congressional redistricting process. Democrats can easily pass an 11-3 gerrymander by splitting Black voters in the Atlanta area into six districts. This gerrymander eliminates all four majority Black districts in the 2022 congressional map, leaving the most Black district at only 47.5% VAP. If Democrats managed to take over full control of the Georgia redistricting process and chose to pass an optimal gerrymander, they would likely end up with something like this. This map improves minority representation, not in spite of the elimination of all four majority Black districts, but precisely due to this significant change. Under this gerrymander, modeling expects ~7.6 Black congresspeople to represent Georgia in the US House each cycle. This is significantly more than the map proposed by Democrats in the Georgia State Legislature in 2021, which would yield an expectation of only ~5.3 Black congresspeople per cycle.
Pennsylvania
Although Democrats are unlikely to seize full control of the Pennsylvania redistricting process before 2030, the party’s majority on the State Supreme Court and a strong showing in the 2022 state legislature elections keep the possibility open. Right now, Democrats represent 9 of Pennsylvania’s 17 seats in the US House, but a gerrymander could easily increase this margin to 11-6 with a map like this. An effective gerrymander would mean splitting Black voters in Philadelphia into more congressional districts and eliminating the only Black majority district in the state. Compared to the current map, this new map would increase the projected number of Black congresspeople representing Pennsylvania per term from ~2.1 to ~2.4.
Author’s Note
Why do we aim to maximize the Average Marginal Impact (AMI) of Black voters in a district and call this argmax the “Sweet Spot?”
For those who want a rigorous mathematical explanation, here it is below:
Define the “Sweet Spot” percentage of Black voters within an opportunity district as x. To find x, we don’t just want to maximize marginal impact: marginal impact is still high after its maximum. Say we want to maximize the expected number of Black representatives in a state, defining the number of districts as n the and statewide Black VAP% as b. Since we know the marginal impact of Black voters is increasing (for small x), the optimal strategy is to put no Black voters in some districts and an equal proportion of Black voters x in others. Then we can have n*(b/x) districts with black voters. So, if the probability of each one electing a Black representative given Black VAP% x is P(x), then the expected number of Black representatives elected statewide is P(x) * n * (b/x). Since n and b are exogenous variables, we want to maximize P(x)/x. For those of you with a probability background, you understand we’re maximizing the average marginal impact (AMI) within each district rather than the marginal impact P'(x). So, x can be found as the argmax of the AMI curve.
For those with a background in economics, also consider the following analogous scenario:
Define F(x) as your utility function for a good and F'(x) as the marginal utility function. F'(x) has an inverted U shape, meaning that as x increases, F'(x) increases and then begins to decrease. I want to find this optimal amount of the good to purchase. Each unit of the good costs the same amount, and I am trying to maximize my ratio of utility per dollar spent. Therefore, I want to maximize the value of F(x)/x, which I can do by finding the argmax of the AMI curve, not by maximizing F’(x). Since F'(x) has an inverted U-shape, there exists a unique and real solution to maximize F(x)/x.
It is hard to think of a good where the marginal utility from each unit has an inverted U-shape, but coffee could be a good example. Consider the experience of drinking coffee in the morning. At first, when you're groggy, a sip of coffee may not really help since you’re still uselessly tired, thus providing lower initial marginal utility. As you finish your first cup, you become alert and productive, marking the peak marginal utility. However, consuming more than a few cups could lead to discomfort, like jitteriness or an upset stomach, thereby decreasing the marginal utility (eventually leading to negative marginal utility). This pattern represents an inverted U-shaped curve in marginal utility.
Further Reading
Check out this article by David Lublin et al. for more analysis of minority success in non-majority-minority districts. Lublin coined this “Sweet Spot” term in this great paper. We took a different approach than him, but there is a lot to learn from both methods; his analysis takes a share of “Black Democrats” in a district as fixed and exogenous and focuses on finding the optimal number of Republicans in a district to maximize the probability that a Black Democrat is elected.
Charles Cameron et al. published an interesting article in the American Political Science Review. We disagree with his conclusion that “outside of the South, dividing minority voters equally across districts maximizes substantive representation.” Lublin published an exceptional critique of this piece which can be found here.
Data
This is really good stuff, both refreshing and deeply insightful. I haven’t seen anyone analyse redistricting in this way before.