
The Great American Political Realignment: Westerville and West Covina
What Precinct-Level Data Reveals about the 2024 Presidential Election

I graduated from Yale a few months ago, and to celebrate I’ve been enjoying a lot of great food in Europe and finishing up my most ambitious quantitative project yet: precinct-level estimates of presidential vote choice by racial group for 2024, as well as for 2020 and 2016. I’ve partnered with the team at VoteHub to make the results available to the public here through their new app, which lets you explore my 2024 estimates aggregated across almost any geography you want. I’ll be sharing plenty of good stuff on Twitter in the coming days (there’s definitely more demand for my short-form content than my long-form), but I want to give a more detailed walk through some of the most interesting findings here. I’ll start with the big-picture political alignment and then dig into the empirical data that supports it. My goal is to put together a readable 10–15 minute summary of how demographics and political coalitions shifted in 2024. Who you are—your age, ethnicity, gender, sexuality, race, income, education, or even your home ZIP code—tells us a lot about your political behavior and how it has changed in recent years.
(This is not meant to be a methods piece, but if you are curious about how I produced the estimates I’ve linked a more formal explanation here)
I will frame this analysis through two towns: Westerville, OH and West Covina, CA.
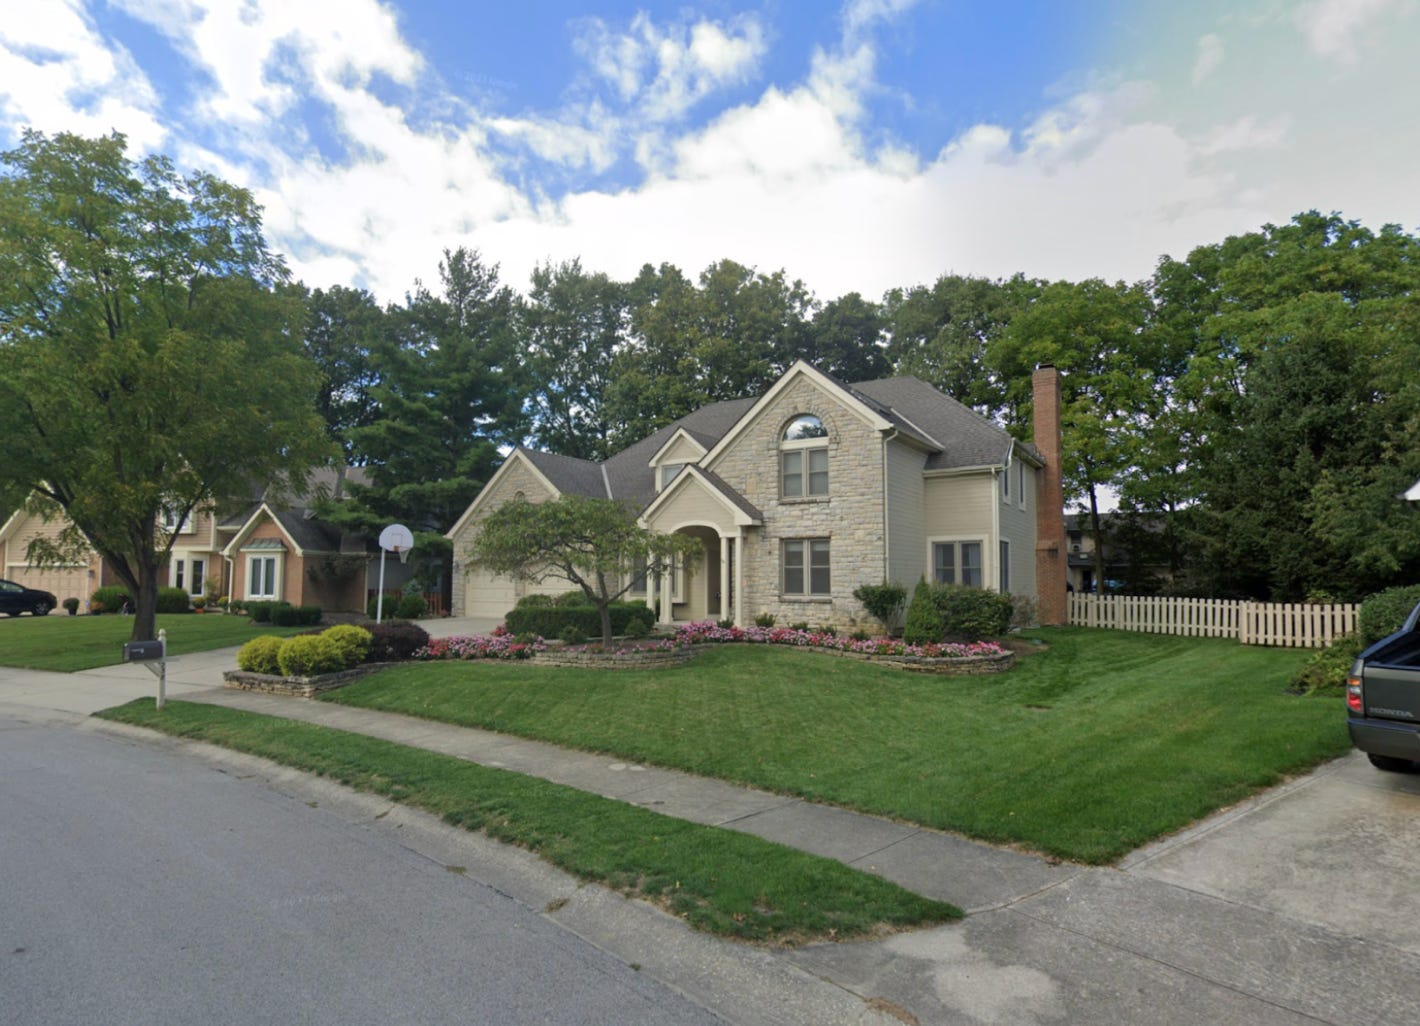
Westerville, Ohio — a family-oriented suburb outside Columbus with manicured lawns, strong schools, and golf courses — is the kind of place once seen as reliably Republican but now increasingly Democratic. It exemplifies the suburban areas where Democrats are gaining ground.
West Covina, California — a diverse community near Los Angeles with many residents who are immigrants or children of immigrants from Mexico and Asia — was long considered safely Democratic but is now edging toward toss-up status. It exemplifies the diverse, once-solidly blue areas where Republicans are making inroads.
The Great American Political Realignment
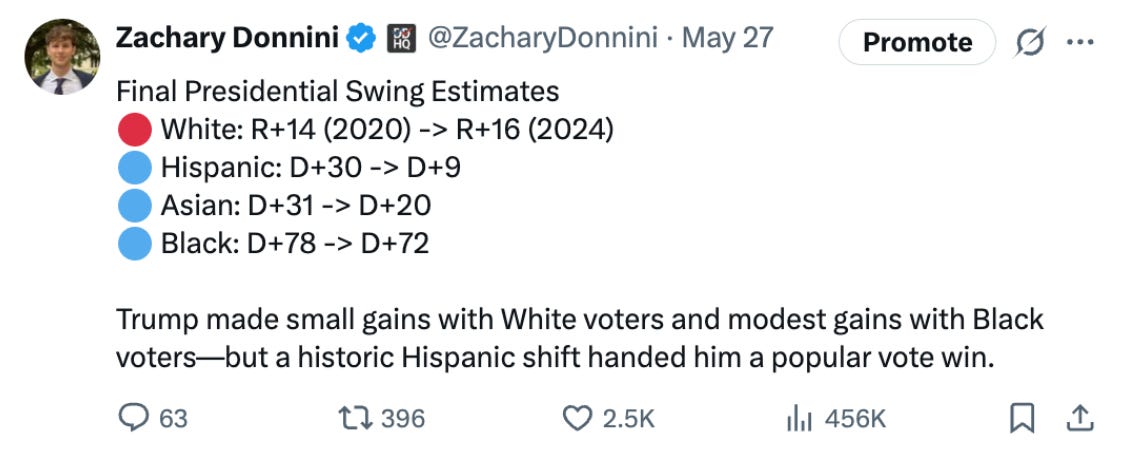
Over the past eight years, America has undergone a major political realignment. Democrats have traded their diverse working-class coalition for a new base anchored by just two groups: cosmopolitan White voters and Black voters. Meanwhile, Republicans have maintained their stronghold among rural and exurban White voters while massively cutting into Democratic margins with Hispanic and Asian voters, particularly across the Sun Belt and parts of the urban Northeast.
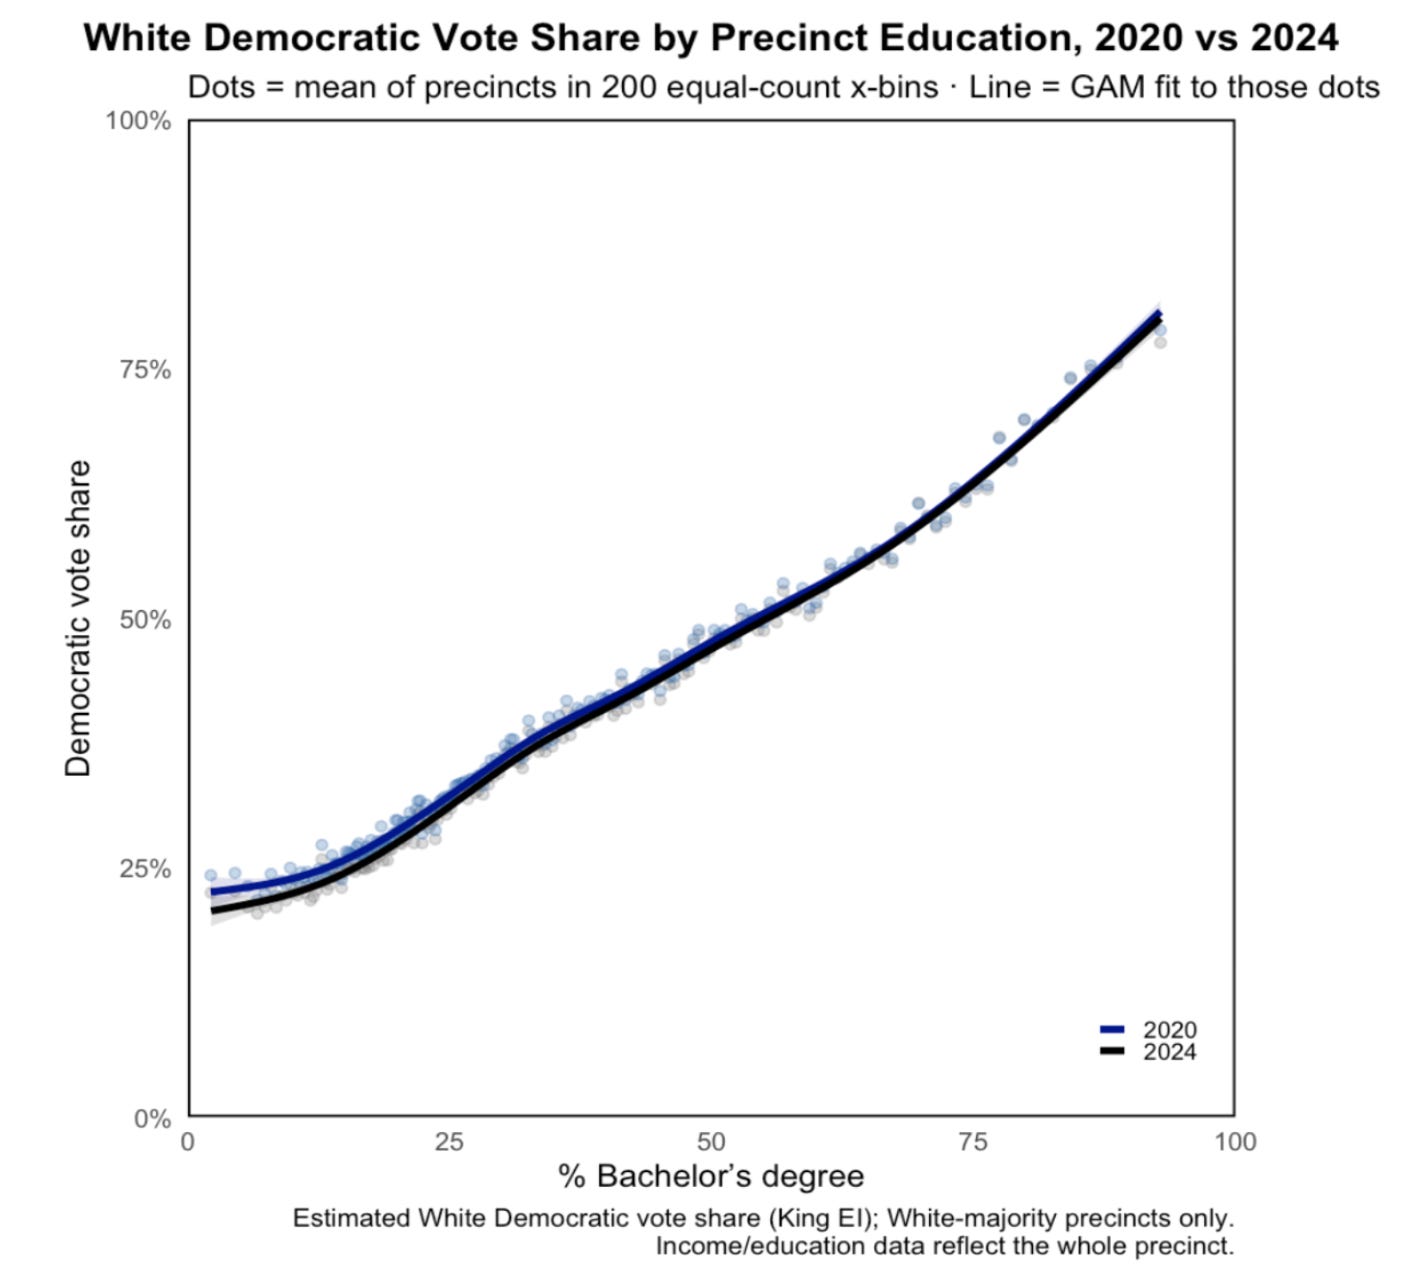
The degree of White educational polarization in the United States cannot be overstated. The relationship between the share of adults with a bachelor’s degree and the estimated White Democratic vote share in White-majority precincts is strikingly clear and consistent.
I think most people reading this have probably heard before about the dynamics I’m describing here, but geographically, here is what this has looked like:
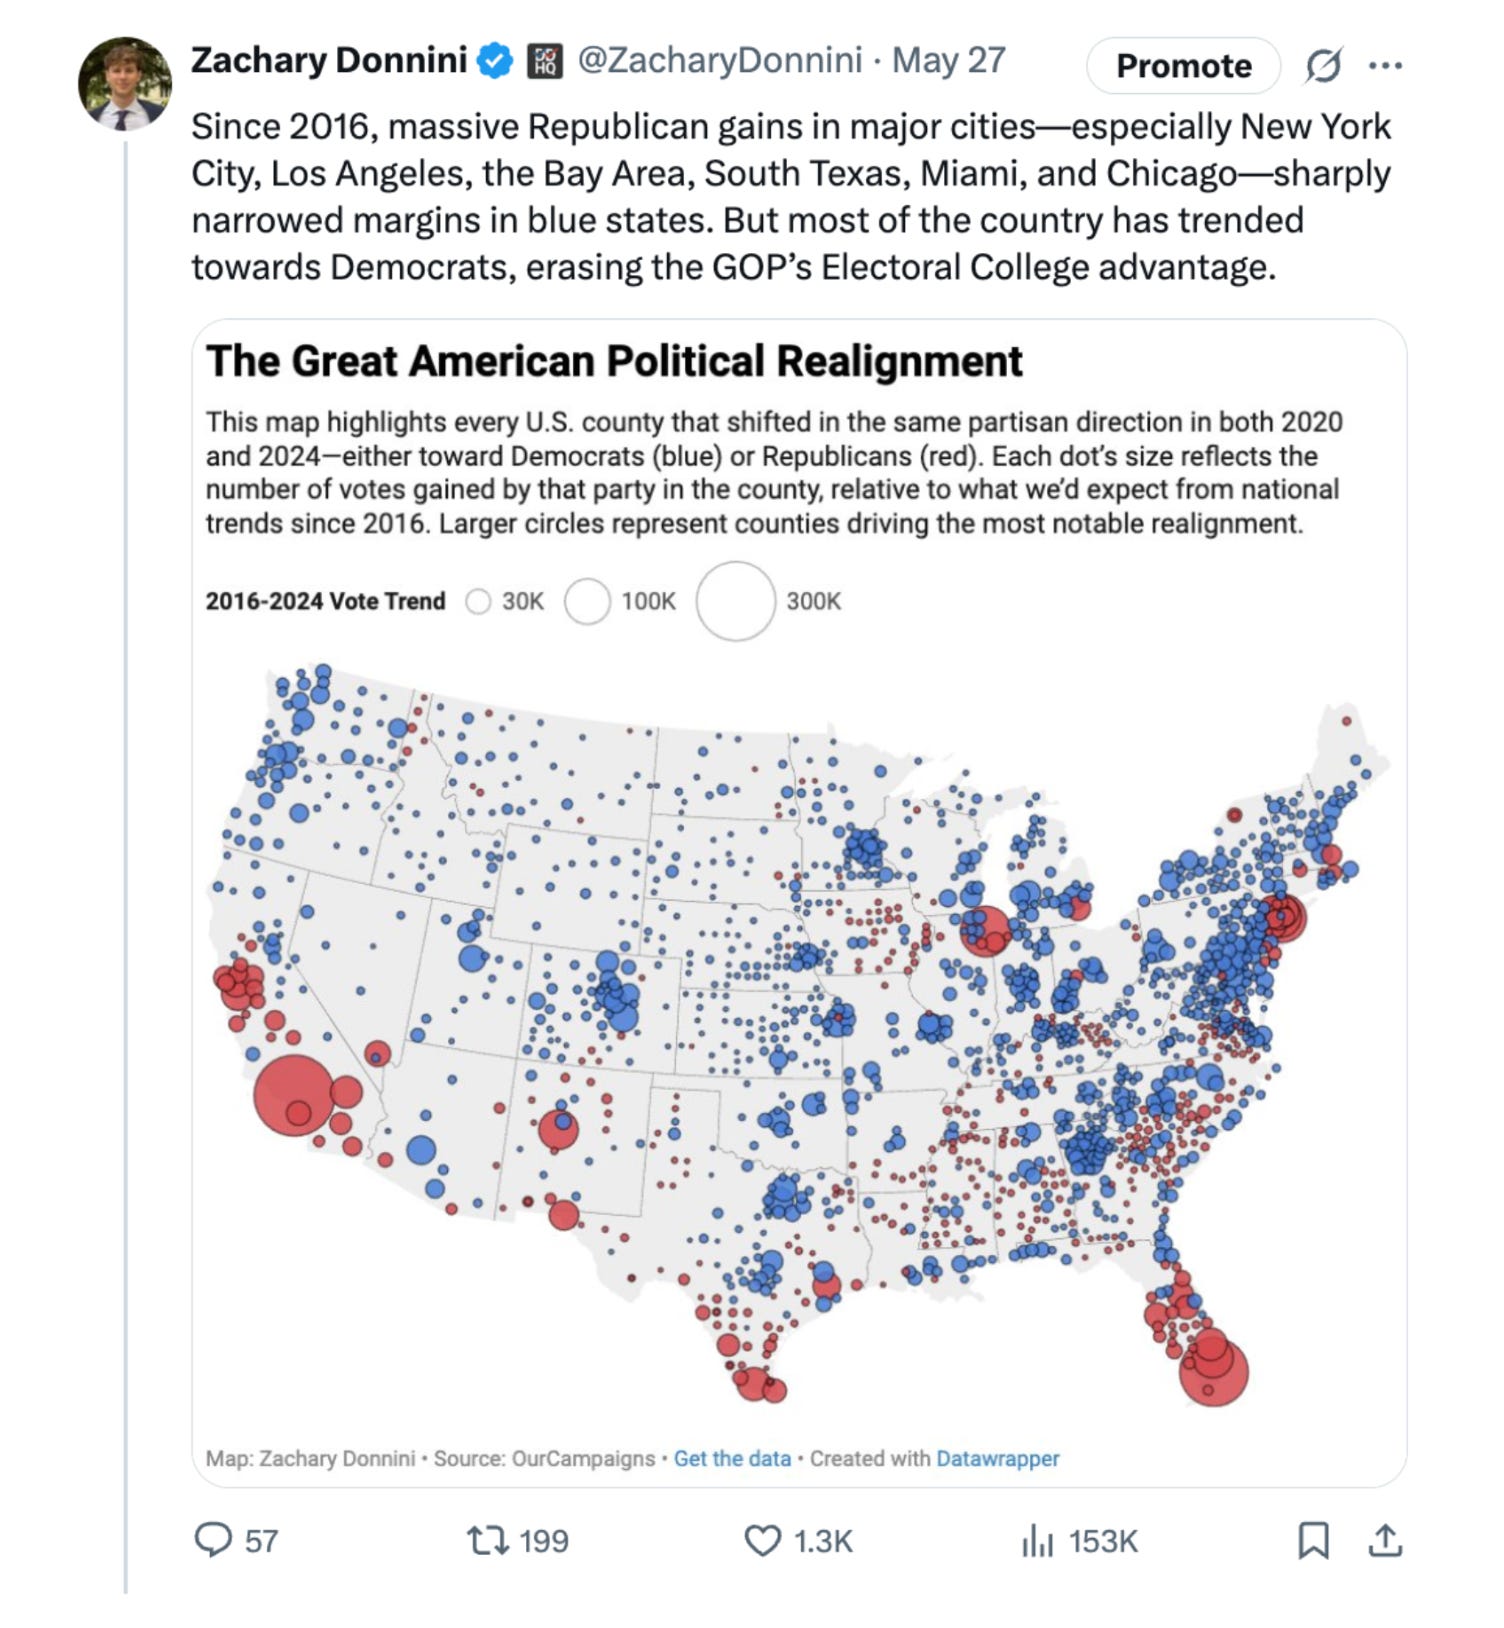
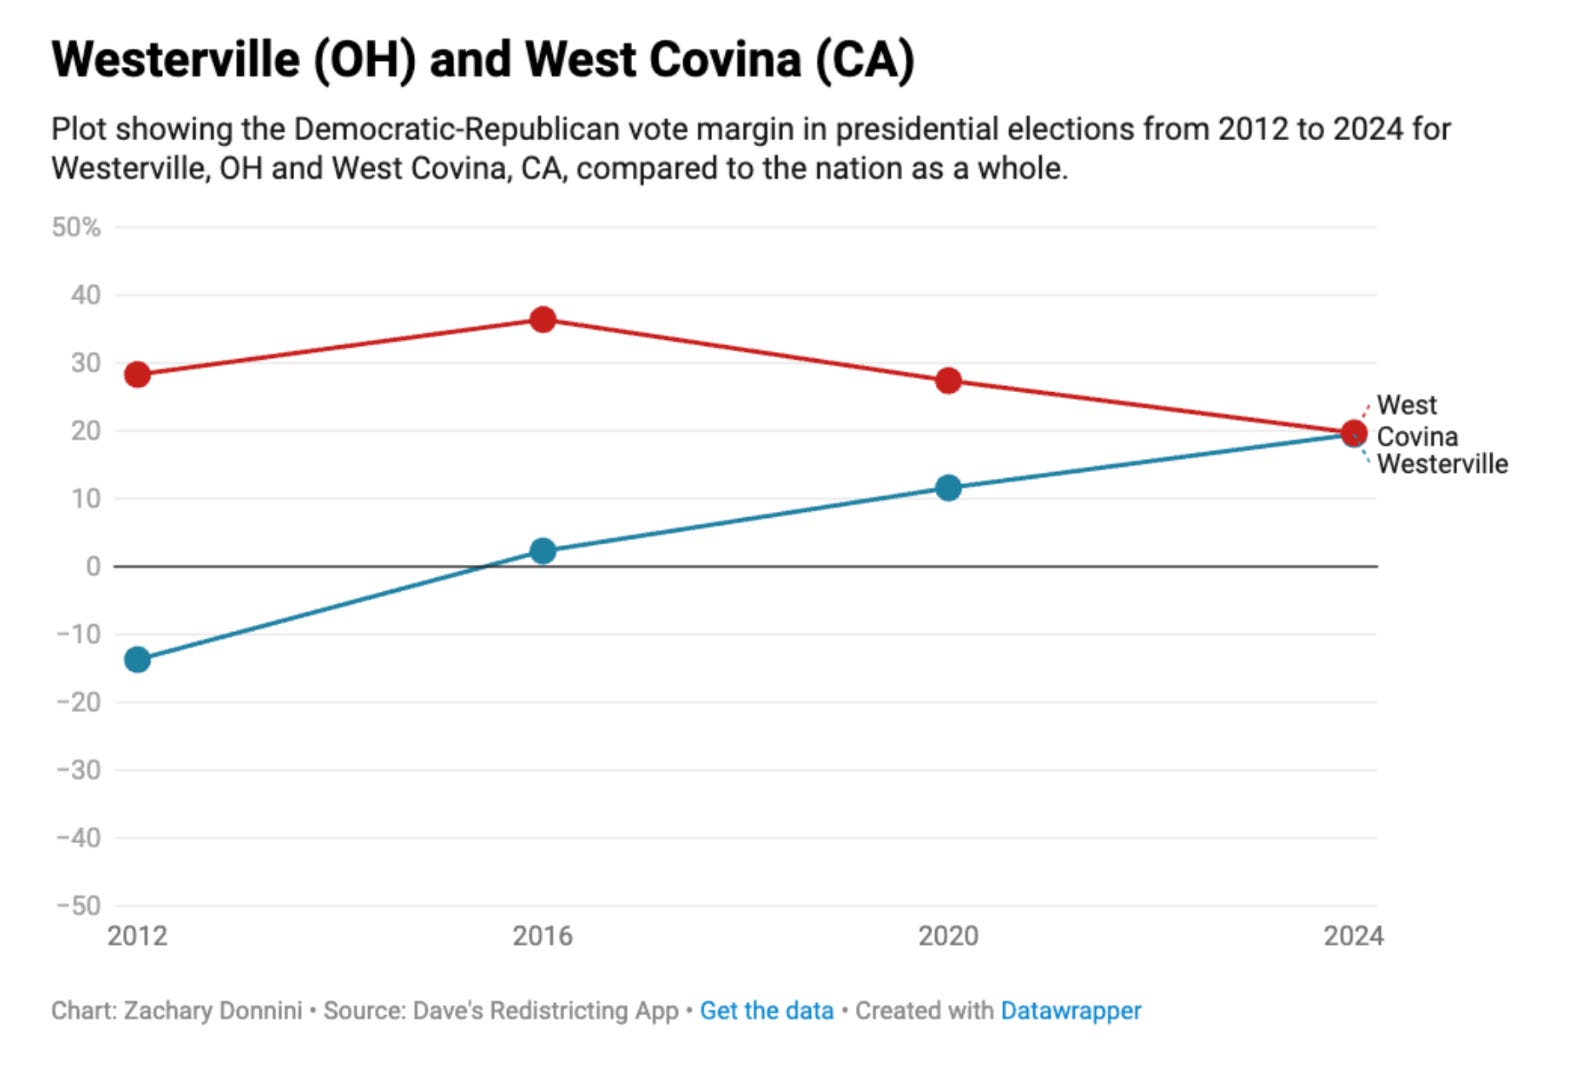
Northern suburbs have driven the shift toward Democrats, while heavily Hispanic and Asian urban cores have trended toward Republicans. I focus on two towns that embody these opposing movements. In 2012, West Covina, CA was over 40 points more Democratic than Westerville, OH. By 2024, the two communities voted almost identically.
The Great American Political Realignment (R to D): Westerville, Ohio
Westerville, OH is an inner northern suburb of Columbus, only about a 20-minute drive from downtown. Biden carried it by 16 points in 2020, and Harris actually expanded that margin to 18 points in 2024—even as she lost ground nationally. Why? Westerville exemplifies all four traits that made for the strongest Democratic shifts in 2024: (1) White, (2) Anglo-Saxon, (3) adult, and (4) upper-middle class voters.
First and foremost, Westerville is very White—82% compared to 58% nationwide. Only 3% of the population is Hispanic and 4% is Asian. Across the country, Hispanics shifted heavily toward Trump, and Asians trended that way too (which is why Harris performed worse in nearby Columbus suburbs like Dublin and Orange Township, which have much larger Asian populations than Westerville). Nearly all of the places where Harris improved on Biden’s margins were overwhelmingly White, and Westerville fits that pattern.

Westerville isn’t just White—it’s very Anglo-Saxon. The two most common White ancestries in the suburb are German and English. In 2024, “White ethnic” voters such as Italian, Irish, Jewish, and Portuguese shifted much more strongly toward Trump than voters of German, English, Dutch, or Scandinavian descent, even after controlling for education. This was especially evident among Italians and Irish across the Northeast, but it also appeared in White ethnic enclaves around Chicago and northeastern Ohio, and even in the Irish mining town of Butte, MT, which swung four points towards Trump than any other town of similar size in the state. To me, this is one of the most fascinating and puzzling trends of 2024. One possible explanation is that Biden at the top of the ticket boosted Democrats among White ethnic Catholics in 2020, but even comparing 2016 to 2024 shows a consistent Republican drift among these groups. Just as Asian and Hispanic voters consist of diverse subgroups with distinct patterns, White voters also vary internally, and ethnicity remains an important dividing line.
Westerville is primarily a “family suburb.” It has about 40,000 residents, a small downtown, and 77% of housing structures are single-family units compared to 55% in Columbus. About 60% of residents are married, compared to just 37% in Columbus. Democrats struggled significantly with young people, especially young men, in 2024 as I have written about constantly and as highlighted in post-election reports by David Shor and Catalist. Harris did great in Westerville, but just 10 miles away, shifts on the Ohio State campus (which is also dominated by highly educated White voters) were very unfavorable for Harris. Westerville, however, is more about parents casting ballots, with kids either too young to vote or that have already moved out.
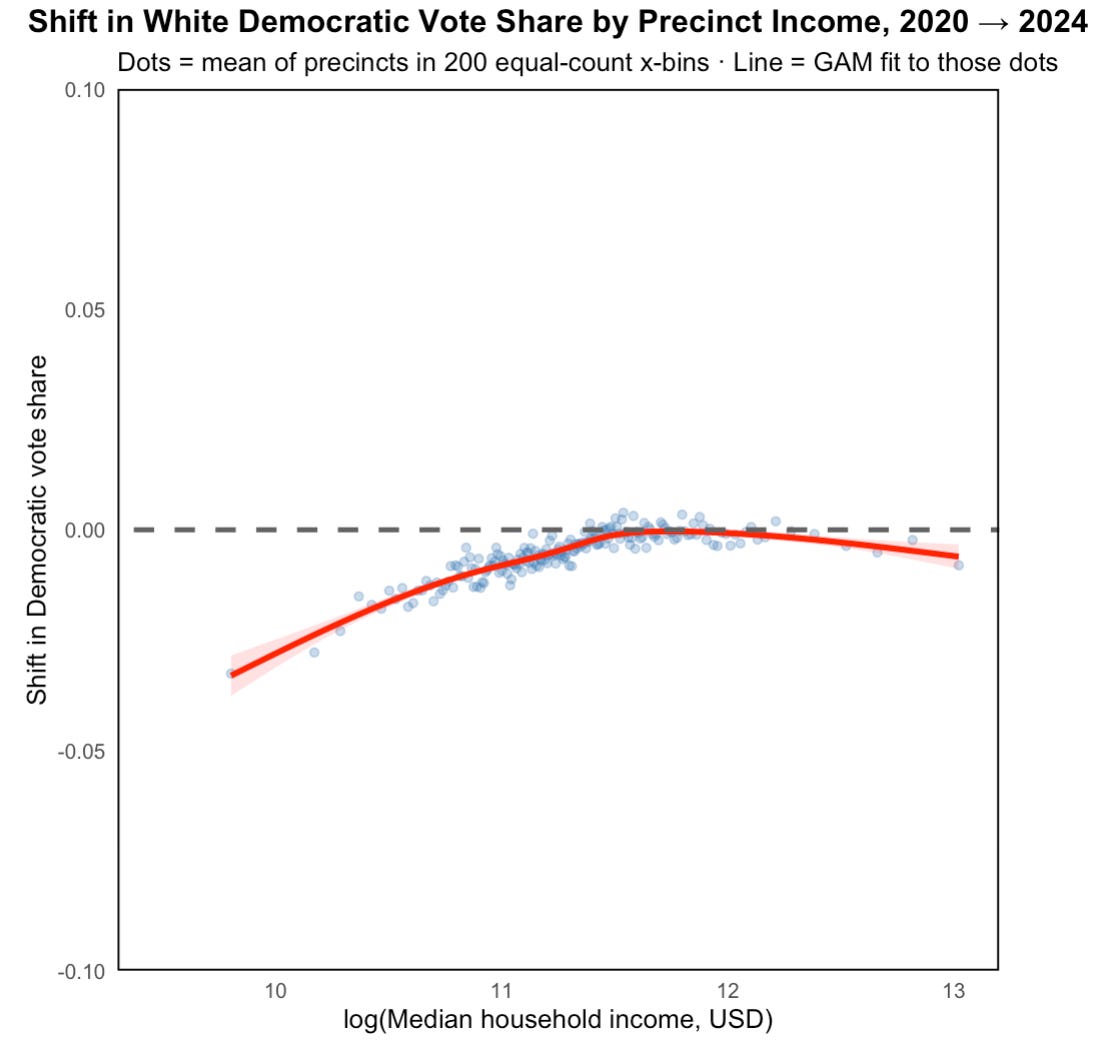
Westerville is an upper-middle-class suburb, but it does not have a large concentration of ultra-wealthy residents. Harris actually performed a few points better there than in some of the wealthiest enclaves in the country—places like Greenwich, CT, the Upper East Side of Manhattan, Highland Park, TX, and Bel Air, CA—where Trump made major gains. This points to a broader development in 2024: education polarization still defined the electorate, with college-educated voters (especially White ones) leaning Democratic, while non-college Whites and an increasing number of non-White working-class voters leaned Republican. That basic pattern held, but something new emerged at the very top of the income ladder. Trump made meaningful inroads with a narrow group of highly educated elites in business, tech, finance, and crypto. Figures such as Elon Musk, David Sacks, Chamath Palihapitiya, Bill Ackman, and Miriam Adelson were either openly supportive of Trump or clearly sympathetic to him. Much of this shift stemmed from frustration with Democratic positions on regulation, DEI, and the general direction of cities and governance. These individuals are not “typical” college graduates—they represent a small slice of the electorate, but their influence over money, media, and political narratives (especially online) is enormous.
That influence is already visible. One of the most undercovered stories of 2025 is how badly Democrats are lagging in fundraising ahead of the 2026 midterms, a sharp reversal from 2018 and 2020 when they had such a cash advantage that they poured resources into longshots in places like South Carolina and Kentucky. So even though education and class polarization still broadly benefit Democrats, the nuance matters. In 2024, suburbs like Westerville were a few points stronger for Harris than the ultra-rich enclaves. It is an early sign that Democrats are no longer reaping the full benefits of educational polarization among a group that, though small in number, wields outsized political and financial clout.

The Great American Political Realignment (D to R): West Covina, California

The worst groups of voters for Democrats in 2024 were Hispanic voters and Asian voters. I chose West Covina as a prime example of this shift because the city includes both populations. West Covina is 51% Hispanic and 27% Asian, and it moved from Biden +32 in 2020 to just Harris +18 in 2024. Nationally, Hispanics and Asians make up only 14% of voters, yet they accounted for 42% of the entire shift toward Trump (in raw votes) between 2020 and 2024.
West Covina itself is a middle-class city with both working-class neighborhoods and more affluent areas, but consistent with the national trend, the movement toward Trump among Hispanic and Asian voters cut across class lines.
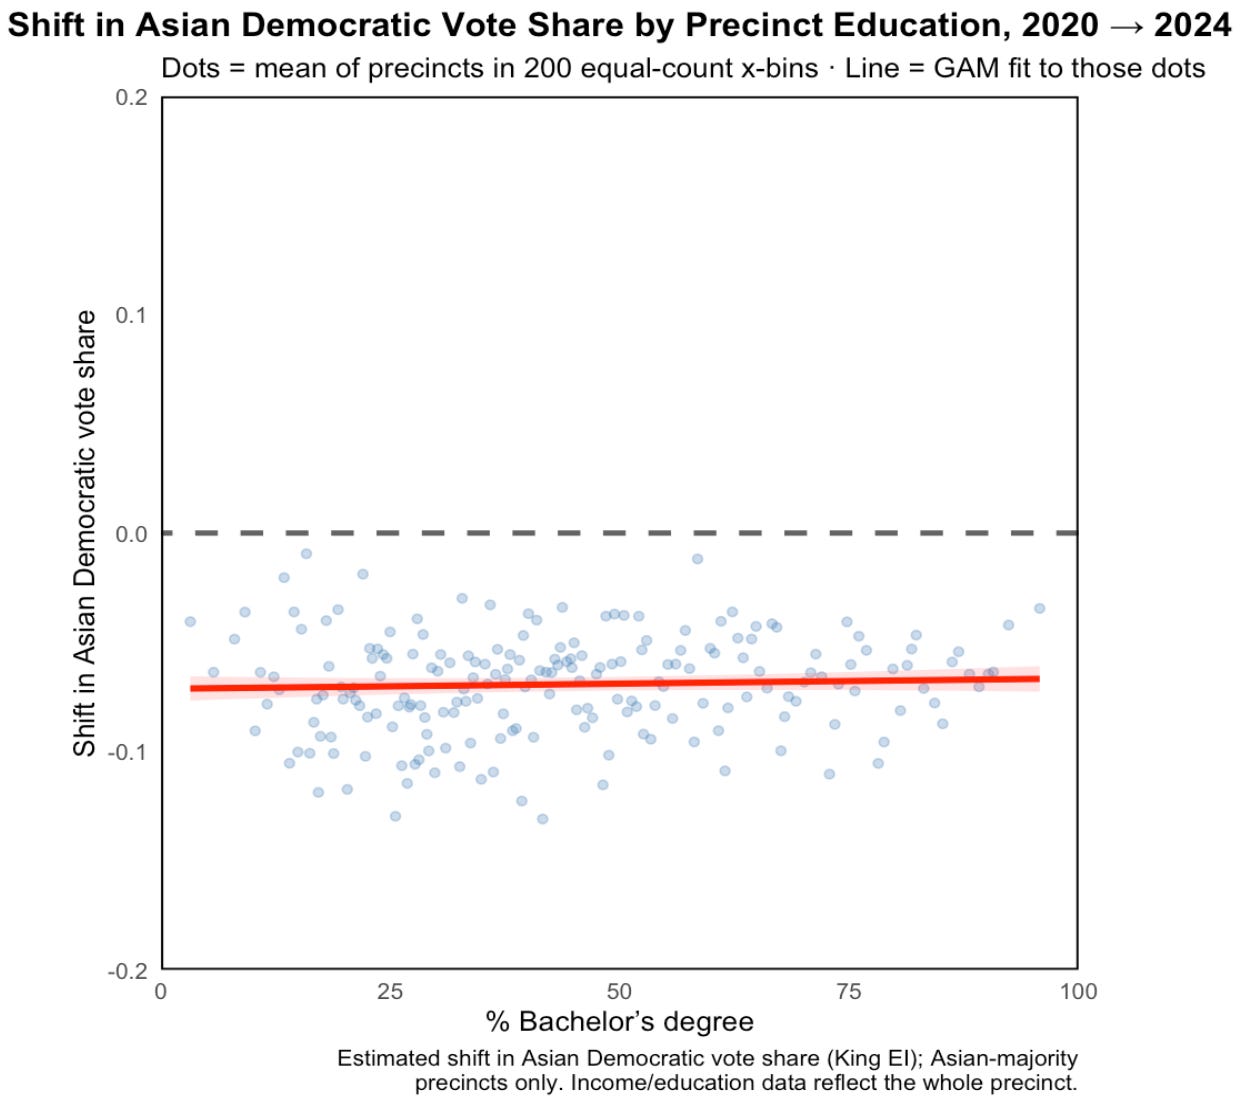
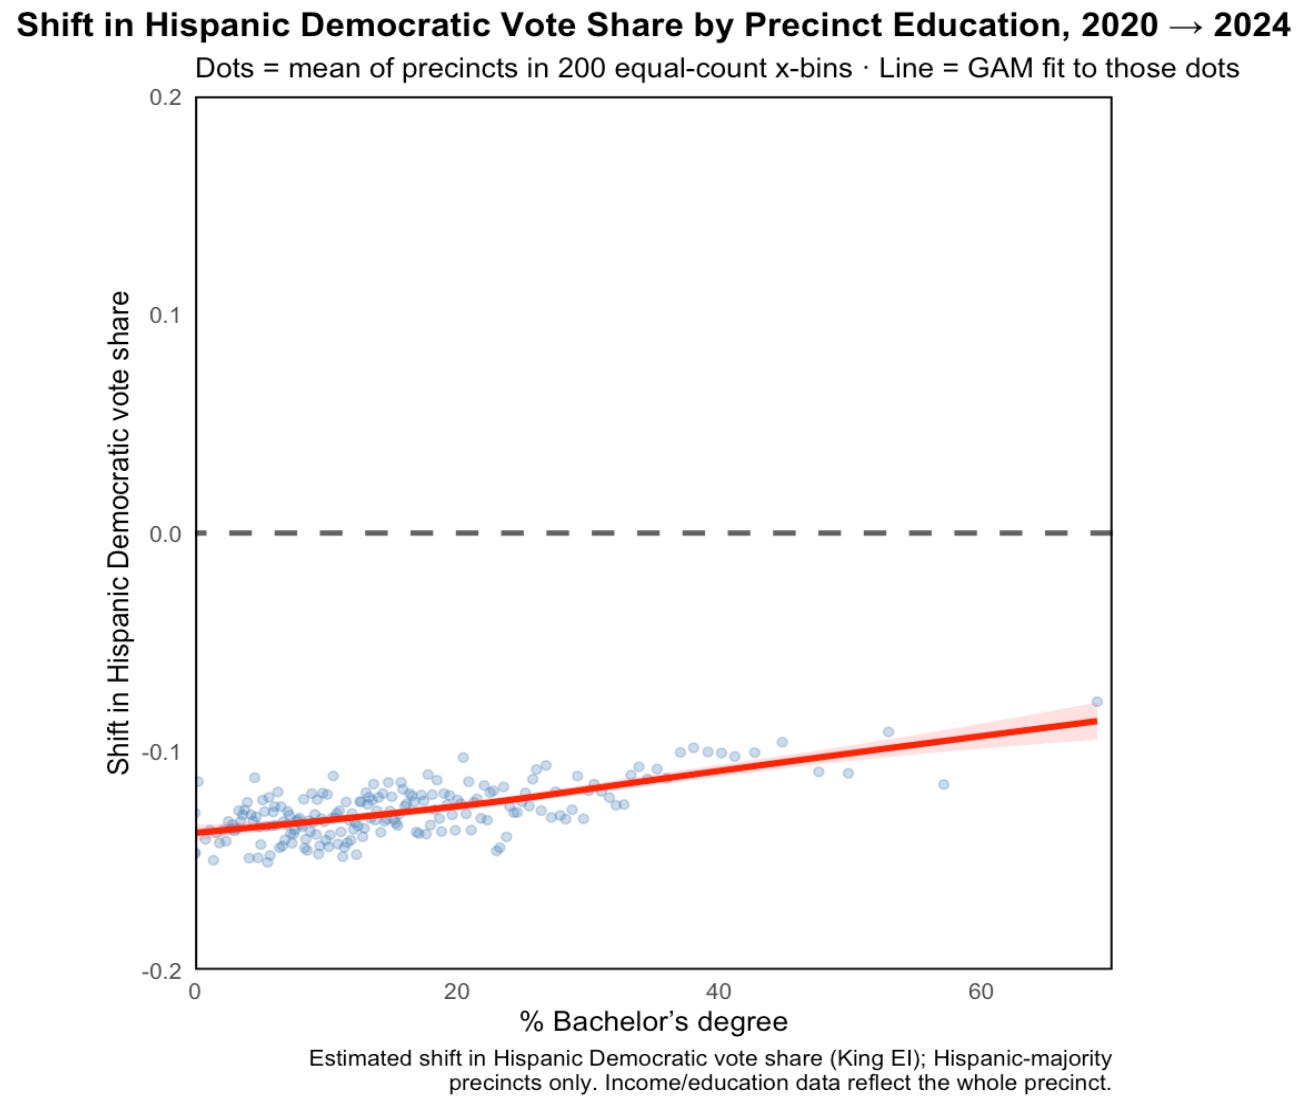
According to my precinct-level estimates, there is essentially no evidence of educational polarization among Asian voters. I find this especially interesting because it clashes with my prior from smaller-scale research and casual scans of precinct results. The likely explanation is that highly educated Asian voters often cohabit with Whites, which masks how strongly highly ed. Asians themselves shifted toward Trump. Among Hispanic voters, there is some evidence of educational polarization, but it is fairly limited. Even in higher-education areas, Hispanic voters still moved sharply toward Trump.
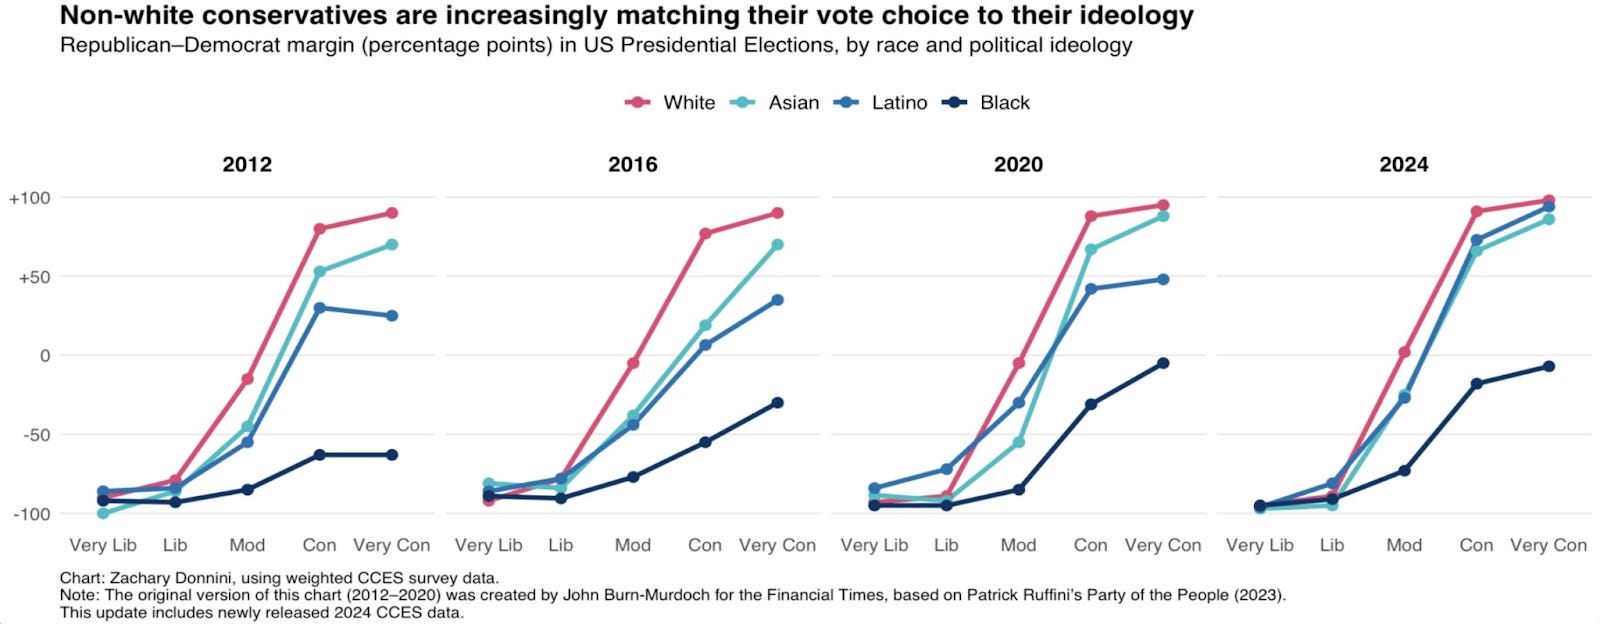
Ideological Polarization
One key way to understand minority shifts to the right is through the lens of ideological polarization. It is not that minority voters are becoming much more conservative overall, but rather that Republican candidates are now performing better controlling for the political ideology voters identify with, as shown in the plot below. In practical terms, Democrats once won a majority of non-White voters who described themselves as “conservative” or “very conservative,” but in 2024 they captured only about a quarter of them. Among Hispanics and Asians who identify as “moderate,” the Democratic margin has shrunk from roughly D+50 to around D+20. These shifts are especially pronounced among younger voters.
A evenly ideologically polarized electorate, controlling for race, would have the four lines in the figure below stacked on top of each other. The 2024 graph (mostly converging except for the dark blue line) suggests Republicans still have significant room to grow with Black voters, and a bit more room to gain among Hispanics and Asians.
Hispanic Voters
As in the country as a whole, West Covina’s minority shift to the right was primarily driven by Hispanic voters. My estimates suggest Hispanics there moved from about 65 percent Democratic in 2020 to just 54 percent Democratic in 2024. Nationally, Hispanics are now close to a tossup group, and the implications for Democrats are sobering. On one level, it is a rhetorical blow: after years of emphasizing diversity and DEI in their messaging, Democrats are watching minorities, especially young minorities, move decisively toward Donald Trump. On an electoral level, the consequences are bad but not the end of the world. While the shift hurt Democrats in Arizona and Nevada, its larger effect has been to take the massive states of Texas and Florida off the map for the foreseeable future, given how underrepresented Hispanics are in the Senate and Electoral College battleground.
It is also crucial to remember that “Hispanic” is not a monolith but an umbrella covering many distinct groups. Democrats fared poorly with Mexicans, who are concentrated in the West, Texas, and Chicago; Puerto Ricans, particularly in Florida and Pennsylvania; and Cubans, in Miami and Tampa. But even more dramatic losses came among other communities: Salvadorans in the DC area and northeast of Boston, Dominicans in places like Lawrence, Massachusetts, Paterson and Perth Amboy, New Jersey, and Providence, Rhode Island, and Ecuadorians in Queens and New Jersey. The shifts among Mexicans and Puerto Ricans were serious, often up to 15 to 20 points, but the swings among Dominicans, Central Americans, and South Americans reached extraordinary levels, often 35 points or more. In Corona, a heavily Ecuadorian neighborhood in Queens with about 20k Hispanic voters, Biden carried 76 percent in 2020, while Harris won only 54 percent in 2024.
Asian Voters
The implications of the Asian shift to the right are complicated. First, it is concerning for Democrats who hope that racial depolarization, meaning minorities moving toward Trump, can be mostly explained by educational polarization, meaning high-education voters moving toward Democrats and vice versa. Asians are one of the most highly educated groups in the country, yet Democrats are struggling with them, as well as with highly educated Black and Hispanic voters, as my precinct-level analysis shows. Second, Asians are badly underrepresented in American politics. They are concentrated in uncompetitive coastal states like California, Washington, Virginia, New Jersey, and New York. I have written before about how underrepresented Jews are in the Electoral College and the Senate, and the same logic applies to Asians. Since their political strength is expressed most directly at the House level, many of the consequences will be felt there. For example, rumored Democratic gerrymanders in California are now much harder to execute because of the Asian exodus from the Democratic Party.
As with Hispanics, Asian voters are not a monolith but rather an umbrella category that covers many different ethnic communities. Predominantly Muslim South Asian groups, such as Bangladeshis and Pakistanis, appear to have shifted the most to the right. Muslim Indians likely did as well, although the data is thinner. Koreans, non-Muslim Indians, and Chinese Americans all moved strongly toward Trump, with Koreans perhaps shifting the most, though it is difficult to say definitively with the available data. Vietnamese Americans likely shifted the least from 2020 to 2024, and in fact some Vietnamese areas in California actually moved slightly to the left. But this is somewhat misleading, because Vietnamese voters had already swung hard to the right between 2016 and 2020, so in 2024 they were simply ahead of the curve.
Why is the saturation of color (representing the amount of votes) kept constant over geographic areas of dramatically varying sizes?
3-Dimensional representation of volume does not “fix” the “land doesn’t vote” area issue when the presentation is on 2D screens. A large portion of high density “pixels” remain hidden. The result is, no matter how you present it, an overwhelming and disproportionate amount of screen real estate - how most users will consume your content, is dominated inaccurately by one color vs. the other.
Further, most people don’t understand volume and mass anyway. The fact you think this visualization accurately represents the distribution of voting to most "normal" (i.e. non statistician) users is demonstration of that - and you have a degree in statistics.
1. Find a method to source or derive the land area of every precinct
2. Divide the precinct results by the landmass of the precinct to compute an accurate color depth.
The presentation IS the data to those looking at it.